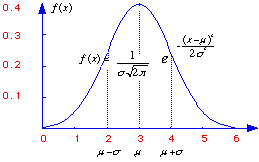
The normal distribution is specified by a mathematical rule. In the figure both the rule and the graph generated by that rule are shown. The symbols mu and sigma are the parameters of the distribution. Once the parameters are known, the distribution is completely specified. It can be shown, although we will not do so (yet) that a good guess or estimate for mu is the mean of the observed values. An estimate for sigma is the standard deviation. Although the standard deviation is a positive number, the mean can assume any value. The distribution is symmetrical with mean, mode, and median all equal at mu. It is interesting to note that the exact specification of the figure shown here was taken from the German 10 DM banknote. The mean equals three, and the standard deviation equals one in this example. On the back of the banknote is a portrait of Gauss.
Importance of the normal distribution
The normal distribution is one which appears in a
variety of statistical applications. One reason
for this is the central limit theorem. This theorem tells us that
sums of random variables are approximately normally distributed if the
number of observations is large. For example, if we toss a coin, the total
number of heads approaches normality if we toss the coin a lot of times.
Even when a distribution may not be exactly normal, it may still
be convenient to assume that a normal distribution is a good
approximation. In this case, many statistical procedures, such as the
t-test can still be used.
Index page |